55 Million: A Fresh Look at the Number, Effectiveness, and Cost of Meetings in the U.S.
Last updated September 3, 2022
Hey there! If you find this article interesting, you may also want to check out the 2022 update: How many meetings are there per day in 2022? (And should you care?)
Hey there! If you find this article interesting, you may also want to check out the 2022 update: How many meetings are there per day in 2022? (And should you care?)

The Story Behind the Numbers
Bad meetings are a big issue in the modern workplace. Just how big of a deal are they? The most frequently quoted statistics say that there are:
- 11 million meetings in the US per day
(as seen recently in Wall Street Journal, Forbes, CBS News, HRM America, CNBC NPR’s Marketplace, Inc.com, MIT Sloan Management Review, …) - Up to 50% of these meetings are a waste of time, costing the US $37 billion per year
(as seen in Business Insider, Inc, BABM, The British Psychological Society)
That’s a big problem – and potentially a good opportunity for the likes of us!
Except, these numbers are wrong.
I know this because I spent a good portion of the past few years accruing all this meeting data. It’s a sad hobby, I know. Lucky for you, I’m going to share what I found here, and will provide links to all the goods so you can draw your own conclusions.
How a nagging doubt becomes a project
We’ve been writing about the state of business meetings for more than 3 years now, and we regularly seek out data to inform our work. When the latest popular post about meeting statistics by Attentiv came around, I decided to check out the sources to see if there was new research we should know about.
For the “11 million meetings” number, the article cited a blog post. That post references yet another blog post, and so on, but the trail never leads to an original source. Hmmm.
I used this same statistic on our blog too, and now I really wanted to know where it came from.
So, I began hunting down as many references to this “11 million meetings a day” number as I could find, looking for some study or rationale behind it. I found it quoted in over 50 publications, all eventually leading to dead ends.
When I started pulling books from our library, I found that the same exact number has been quoted in the literature about meetings since at least 1976, when Michael Doyle and David Strauss first published “How to Make Meetings Work!”.
They didn’t list a source back then either.
The 11 million meetings a day statistic is apocryphal; one of those impressive statements of doubtful authenticity, widely circulated as being true.
Once we realized that this and other core statistics we all love to share about meetings lacked a solid basis, we started gathering all the studies we could find about meetings from the past 20 years in search of better numbers.
Specifically, we dug into three common statistics:
- The number of meetings per day
- The percentage of these meetings considered to be effective
- The cost to the US economy of wasted meetings
Here’s what we learned, along with our updated estimates on what the real numbers should be.
Question 1: How many meetings are there a day, really?
There isn’t any meaningful way to count this, so every number is an estimate based on limited data and wild extrapolation. So let’s examine some limited data from which we can extrapolate!
Michael Doyle
Michael Doyle pioneered a lot of the modern work on running effective meetings that we still reference today. As far as we can tell, the trail of breadcrumbs leads back to his claims.
1976 Quote
Do you have any idea of how many meetings are held every day in the United States alone? More than 11 million!
from How to Make Meetings Work! page 4, by Michael Doyle and David Strauss
1996 Quote
The statistics are staggering.
There are over 25 million meetings every day in the United States and over 85 million worldwide.
Michael Doyle in the Forward to Facilitator’s Guide to Participatory Decision-Making (Jossey-Bass Business & Management Series) by Sam Kaner
New numbers extrapolated from the passage of time
Assuming Michael Doyle had access to research that’s since been lost to the mists of time and that his estimates were sound, we can arrive at a new estimate simply by extending the curve.
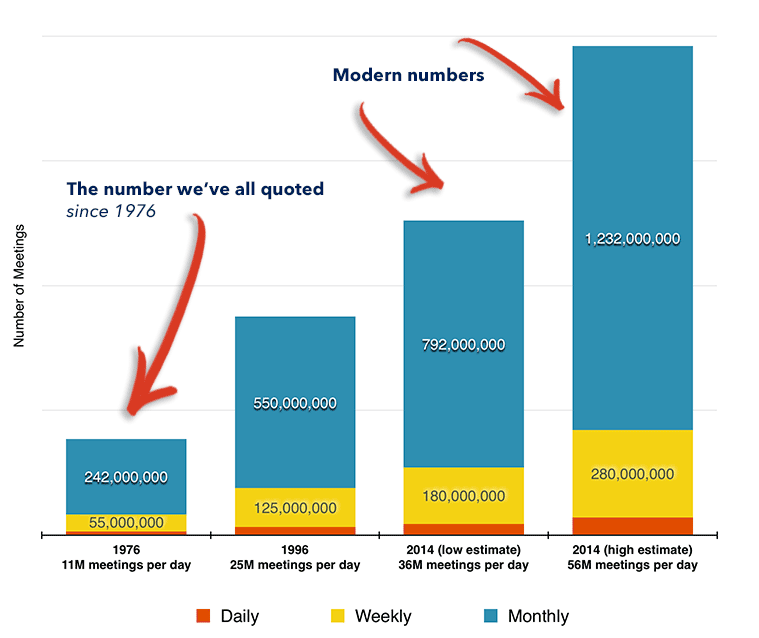
We had 11 million in 1976, then 25 million in 1996. It has been nearly 20 years since the 1996 number was published. If the growth is linear, there are now 39 million meetings per day.
If you multiply 25 million by 2.27 (the multiplier from ’76 to ’96), there are now 56 million meetings per day.
With this method, 39 million is our new low, 56 million our new high.
US Bureau of Labor Statistics
The next method for calculating the number of meetings per day rests on the same assumption – that Michael Doyle knew his stuff – but rather than following an abstract mathematical curve, we’ll see what the number should be if it’s strictly tied to the increase in employment.
We downloaded records for the number of people aged 16 and over who were employed from 1974 through 2015, and used the average for each year.
Here’s a table showing what that looks like.
| Year | # Employed | Ratio* | # Meetings per day |
|---|---|---|---|
| 1976 | 88,753,000 | 7.6 | 11 million |
| 1996 | 126,720,000 | 5 | 25 million |
| 2014 | 146,303,000 | 4 | 36.5 million |
* We know the population and claimed meeting numbers for 1976 and 1996. When you divide population by meetings, you get this ratio. The ratio used for 2014 assumes the trend towards more, smaller meetings continues.
With these assumptions, we get something closer to 36.5 million.
At this point our new low is 36.5 million. The high of 56 million remains intact.
But surely there must be studies!
Yes, there are – but none that attempt to specifically answer the question of how many meetings there are each day in the US.
That’s ok. We have the overall employment data for the US referenced above, and the more granular Occupational Employment data from 2014. Now we just need an idea of how many meetings all these folks have each day, and how many people are in each meeting.
With that information in hand, we can make an educated guess at the number of meetings per day like this.
meetings per day = (people × average # meetings per day) ÷ people in each meeting
There are a handful of surveys that prove useful for this.
Meetings in America
published 1998 by infocom for Verizon, also referred to as the MCI Whitepaper
https://e-meetings.verizonbusiness.com/global/en/meetingsinamerica/uswhitepaper.php
This study is a bit older, but it’s been used as the basis for several recent infographics. As far as we can tell, this study is the source of the oft quoted “62 meetings per month for the average worker” figure.
- Sample:
- Explicitly targeted at heavy meeting-goers
1300 in phase 1
660 in phase 2 - Number of reported meetings:
- 61.8 meetings per month
Dividing this by an average of 22 working days per month results in:
2.8 meetings per day.
But then, these are admittedly “Heavy meeting-goers.” From the late 90’s.
Let’s keep looking.
Microsoft Office Personal Productivity Challenge (PPC)
published 2005 by Microsoft
https://mrb.lynkx-01.nl/Uploads/Files/exec%20summ%20Global%20Productivity%20Study%202-14-05.pdf (missing)
This study looked at productivity in general, and the impact of technology on productivity. Like any good productivity study, they included information about the impact of bad meetings.
- Sample:
-
- 38,112 Information Workers across 200 countries
- (2,973 in the US)
- Number of reported meetings:
- 5.5 hours per week
Well shoot. How long is the “average” meeting?
You can find the best comparative numbers on meeting length and size in a super interesting and detailed report titled: Meeting Analysis: Findings from Research and Practice.
This 2001 paper does a fabulous job pulling together data from meeting studies conducted between 1903 and 1999. Those studies found that 67% of meetings lasted between 30 minutes and 2 hours. We’ll average those, then, and assume an average meeting length of 1.25 hours.
With 5.5 hours spent in meetings each week on average, this indicates each person is in one to two meetings a day, and maybe has a few days without meetings.
Specifically, 5.5 hours/1.25 hours = 4.4 meetings spread over 5 days.
- Average meetings per day:
- .88 per person
I think we’ve just rediscovered the problem with averages.
The Meeting Behavior Survey
published 2013 by Fuze
https://blog.fuze.com/fuze-survey-reveals-u-s-workforce-hampered-by-multitasking-and-disengagement
Fuze conducted a SurveyMonkey survey to look at the impact of multi-tasking on productivity, and how video conferencing could reduce multi-tasking in meetings.
- Sample:
- 2,000 information workers
- Number of reported meetings per week:
-
- 52% spend 1-3 hours (no more than 1 per day)
- 34% spend 4 – 10 hours (average of 2 per day)
- Average meetings per day:
- 1.2 per person
That’s pretty consistent with the Microsoft numbers, but a lot lower than the Verizon number. Let’s look at one more.
Collaboration 2.0: Death of the Web Conference (As We Know It)
published 2014 by Ovum and join.me from LogMeIn
https://solutions.join.me/collaboration_study (Missing)
This study looked at how meeting behavior is changing with the introduction of new technologies and the changing work culture.
- Sample
- 3,926 full time employees across 19 international markets, from all major industry categories
- Number of reported meetings per week:
-
- 8 for all employees in all industries
- 12 for senior executives in all industries
- 17 for senior executives in collaborative industries
Sweet! Actual numbers of meetings, versus time spent! Let’s see how it lines up. If we divide the number of meetings per week by the number of working days in a week (5), we arrive at the following number of meetings per day for all employees vs. senior executives.
- Average meetings per day:
-
- 1.6 for all employees
- 2.4 for all executives
- 3.4 for executives in collaborative industries
Putting it all together
Managers meet more, and always have. One review of 6 CEOs conducted in 1973 found they had an average of 8 meetings per day.
Why does this matter for our purposes? Let’s get back to our equation:
meetings per day = (people × average # meetings per day) ÷ people in each meeting
There’s a big difference between the average meetings per day for managers versus everyone else. The range of meetings per day for managers was between 2.8 and 3.4. For everyone else, the range was between .88 and 1.6.
For simplicity’s sake, and because it’s all kind of thumbs in the air anyway, let’s simplify that to 3 meetings per day for managers and 1.2 meetings per day for everyone else.
Now, let’s rework the equation.
 ((managers × average # meetings per day) + (everyone else × average # meetings per day))
 ÷ people in each meeting
We already have the number of employed people from the BLS. 146,303,000.
The BLS also shares the number of people in Management Occupations for 2014. It’s 6,741,640. This leaves the number of employed people who aren’t managers at 139,561,360.
And now we have some reasonable numbers to use for our numerator – or the number of meetings experienced by people in a day. We’re going to call these individual meeting experiences!
 ((6,741,640 × 3) + (139,561,360 × 1.2)) =
 187,698,552 individual meeting experiences
187,698,552 individual meeting experiences / people in each meeting
Now, to find the number of meetings, we need to figure out how many individuals are sharing each of those meeting experiences.
Let’s find the “people in each meeting” denominator.
How many people on average in each meeting?
The Meeting Analysis paper mentioned previously includes two tables that show different findings for how many people attend each meeting.
Oral Communication Episode Size by Percent (Based on 436 Oral Communication Episodes)
| Attendees | % of meetings |
|---|---|
| 2 | 65% |
| 3 | 12% |
| 4 | 4% |
| 5 | 2% |
| 6 | 4% |
| 7 | 3% |
| 8 | 1% |
| 9 | 2% |
| 10 | 1% |
| > 10 | 5% |
I am frankly delighted to get to share a table with you entitled Oral Communication Episodes. I also think the math here works out to a weighted average of 3.5 attendees per meeting.
Meeting Size by Percentage (Based on 903 Meetings)
| Attendees | % of meetings |
|---|---|
| 1–5 | 20% |
| 6–10 | 41% |
| 11–15 | 17% |
| 16–25 | 9% |
| 26–90 | 10% |
| > 90 | 3% |
This table came from a 3M study in 1990 in which they published the average as 9 people per meeting.
The Ovum study divided meetings into one-on-ones and everything else. So, two people, or … argh, just more, ok?
Their findings:
| Attendees | % of meetings |
|---|---|
| 2 | 47% |
| more than 2 | 53% |
There are three problems with this part.
- Each study has a pretty limited sample size.
- The data doesn’t match up well. One set gives us detailed numbers, one set gives us ranges (how many 1 person meetings did they count in the 1–5 range anyway?) and the final study loses precision for all numbers greater than 2.
- They clearly don’t agree on the definition of a meeting.
So – let’s calculate our data-driven estimate of the number of meetings per day in the US two ways.
First, we’ll use the simpler 3.5 number for attendees per meeting. We calculated 187,698,552 individual meeting experiences above. Let’s bring back our handy dandy formula!
187,698,552 ÷ 3.5 people per meeting = 53,628,158 meetings per day
Woo. Ok, let’s try it by making a distinction between 2 person meetings and bigger meetings using Ovum’s breakdown and 3M’s average for the bigger meetings.
 ((47% × 187,698,552) ÷ 2 people per meeting) +
 ((53% × 187,698,552) ÷ 9 people per meeting) =
 55,162,519 meetings per day
Surprisingly close to that 56 million number we had back in the beginning!
Between 36 and 56 MILLION meetings every day in the US
Lots of fun with spreadsheets later, and that’s our answer. Not quite as definitive as “11 million”, but a lot better informed.
Why these numbers might be high
- We counted all the employed people, regardless of whether they worked full time or part time.
- We counted people from all occupations.
Some people surely meet more than we’ve counted, as consultants, therapists, educators, lawyers and other meeting-heavy professions got lumped in with the non-managerial “everyone else”.
Some are clearly overrepresented. In this same time period, the SBA estimated there were 20,367,000 sole proprietorships. There’s a good chance many of these folks meet less frequently.
Why these numbers might be low
- We’re only looking at certain kinds of meetings.
While none of the studies clearly defined what counted as a meeting, their sample populations and questions indicated a focus specifically on “task-based meetings” in the workplace.
Many big corporate meetings fall outside of this scope: board meetings, shareholder meetings, etc.
- Meetings related to job hunting, student life, or starting a business aren’t included.
For every job interview, placement review, student disciplinary hearing, and so on, the only people represented are those getting paid to be there.
- We didn’t count ANY meetings attended as a volunteer.
It wasn’t just job hunters and students we excluded; every meeting someone attends outside of work was left out. Every school PTA, every religious group, every set of people that organizes or supports or champions or educates or advocates on their own time also meets, and those meetings aren’t a part of this calculation.
Question 2: How effective are all those meetings?
Next, let’s cast our critical eye onto the statistics that speak to meeting effectiveness.
In 1990, 3M conducted one of the most detailed studies available on the state of business meetings. In the introduction, they state:
Finally, despite the plethora of fiction about meetings in American society, there is very little scientific research reporting the facts or testing theory.
The 3M study worked to address that issue, and a handful of studies have tackled the subject since then.
But the actual scientific data we have about meeting effectiveness is very slim, very limited, and generally ill-suited for making cool infographics.
Myths about wasted time in meetings
Most of the shocking and widely repeated claims about meetings as a waste of time are derived from misrepresentations of the studies we’ve looked at already.
Let’s deconstruct a 2015 example that includes this popular claim: that the US wastes $37 billion in ineffective meetings each year.
Every day, there are 11 million business meetings in the US, and 50% of these meetings are deemed a waste of time. … Most professionals spend 62 hours per month in meetings according to a recent study by Atlassian. Thus, most employees feel they waste 31 hours every month in unproductive meetings, almost one full week of work! … In sum, the estimated cost of unproductive meetings is $37 billion US dollars per year.
How We Waste $37 Billion Per Year in Meetings
The bulk of that article includes solid advice about running better meetings, and the author relies on the Atlassian infographic for accurate data. Like I said, I’ve done this too – so no fault! Atlassian’s very cool graphic points to the 1998 Verizon study.
The Verizon study itself blithely quotes the apocryphal 11 million meetings number, and, as we now know, then goes on to describe the habits of hand-selected heavy meeting goers.
Both the 11 million total and 62 meetings per month numbers are wildly inappropriate as a foundation for calculating US spending.
What’s more perplexing: several articles (example: this one) lead to this study as the source for another widely shared statistic, that claims “50% of meetings are unproductive”.
The Verizon study says no such thing.
The section 7.1 of the Verizon report section states:
Overall, the respondents thought most of their meetings were quite productive. 22% of meetings were deemed “extremely productive.” 44% were “very productive” and 27% were only “somewhat productive.” The respondents said that 6% were “not very productive” while only 1% were “not at all productive.”
My math says that this adds up to 93% of meetings deemed at least somewhat productive, and 7% as not productive.
93% positive > 50% positive; I’m not sure where the confusion crept in.
All that aside, we still couldn’t figure out a way to arrive at this $37 billion price tag using any combination of these numbers. Finally, we dug up a 1989 Industry Week article titled A $37 billion waste: that’s the annual cost of poorly planned and poorly run business meetings. We didn’t find any sources in the article so don’t know how they got that number, but given that this was published 26 years ago, we figure it has little modern relevance.
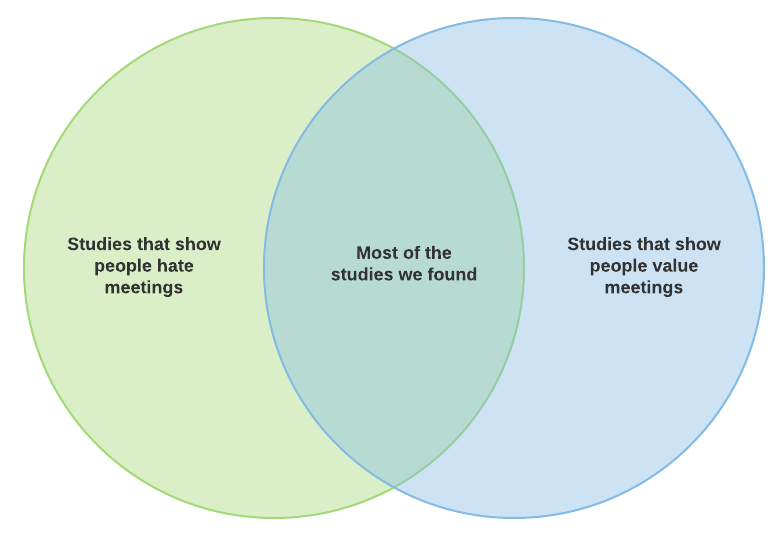
It’s cool to hate meetings
The data with known sources that we do have reflects a workforce that’s down on meetings. Several surveys ask people questions like these:
- Do wasteful meetings ever get in the way of your work? What percentage of your time do you estimate you spend in wasteful meetings?
(57% say yes, with 8% of their time wasted – WorkFront 2015) - Are meetings productive, or unproductive?
(71% say unproductive, and consistently rank ineffective meetings as a top time waster – Microsoft 2005) - Where does “too many meetings” rank on the ways that your time gets wasted at work?
(#2, tied with annoying coworkers, but after browsing the Internet – Salary.com) - Would you rather go to a status meeting, or endure a root canal?
(8% opted for the root canal – Clarizen 2015)
The questions reveal a built-in assumption that meetings waste time, and lead to some pretty spectacular blog posts. “Survey Reveals Almost 50 Percent of Respondents Would Rather Go to DMV, Watch Paint Dry!”
But a funny thing happens when you tweak the question.
In the Clarizen survey where “almost 50%” of people claimed they prefer getting a mullet to status meetings, only 35% of those same people were willing to call status meetings “a waste of my time.” Makes you wonder about that 15% in there who don’t consider the meetings a waste of time, but would still rather go to the DMV.
And when WorkFront changed their question from one about wasteful meetings to this:
“Overall, how effective or ineffective do you think each of these types of communication is at your company?”, 84% of respondents rated face-to-face meetings as very effective or somewhat effective.
84% effective, 16% ineffective, which looks a bit more like results from the Verizon survey.
A Researcher’s Perspective
Steve Rogelberg and team are responsible for most of the real research we have on meeting effectiveness from the past 10 years. This excerpt from their paper perfectly explains what we’re seeing in the survey results.
What Do Employees Think About the Meetings They Attend?
The minute we tell an employee or leader we are studying meetings, many launch into what we refer to as the “meeting hell” lament: “If you want to know about bad meetings, you should shadow me for a day!” was a common response. Some of the data we collected was consistent with this anecdotal experience: More than half of the employees we surveyed said they publicly complain about their meetings. But there was an intriguing paradox within this self-characterization. The majority of the individuals in the “complainer group” actually admitted that they did not feel as negatively as they indicated publicly.
Indeed, in private surveys employees offered accounts of effectiveness in meetings that were quite favorable. When asked about meetings in general from a productivity perspective, a significant majority responded positively: in round numbers, 17% called them very good to excellent; 42% rated them good; 25% rated them neither good nor bad; and just 15% rated them poor or worse. When asked to rate the productivity of their most recent meeting, the responses were even more positive: 36% rated them as very good to excellent; 33% rated them as good; 16% rated them as neither good nor bad; and 16% rated them as poor or worse.
The Science and Fiction of Meetings by Steven G. Rogelberg, Cliff Scott and John Kello, Winter 2007 MIT Sloan Management Review

Question 3: What is the cost to the U.S. economy of wasted meetings?
The most quoted number says $37 billion dollars per year. As we mentioned above, this figure first surfaced in 1986, so even if it was a reasonably accurate number at the time, it certainly doesn’t apply to a modern workforce running 9 to 14 billion meetings per year.
We do not have a meaningful way to describe or measure what counts as a “wasted” meeting, so trying to get a single number on what the cost of this unmeasurable waste is doesn’t make sense.
We can, however, get a range for what this wasted expense could be using our new estimates on the number of meetings and some guesses about how many meetings might qualify.
Let’s do some more math. First, we need to figure out what the total cost of meetings in the US might be. Because this is all just an exercise to help inform the discussion and theoretical anyway, we’ll use the simplest numbers from our calculations.
- Individual meeting experiences per day: 187,698,552
- Meeting length: 1.25 hours
- Hourly salary for each attendee: $25.20 (based on current average private sector hourly salary)
- Working days per year: 240 (allowing for holidays and vacation)
(# individual meeting experiences × length × salary) × days per year = Total meeting cost per year
(187,698,552 × 1.25 × $25.20) × 240 = $1,419,001,053,120 meeting cost per year
Based on this gross oversimplification, we’re using just over $1.4 trillion as the amount spent on meetings in the US every year. Seems high to me, but then again, we do all meet an awful lot, and some people get paid way more than $25 dollars per hour when they do.
Next, let’s calculate how much money we could be losing due to bad meetings. We’ll start by looking at the cost if only an optimistic 5% of meetings go poorly, and run the numbers up to show the wastage if fully 20% of the meetings fail.
| % Ineffective | Money Wasted |
|---|---|
| 5% | $70,950,052,656 |
| 10% | $141,900,105,312 |
| 15% | $212,850,157,968 |
| 20% | $283,800,210,624 |
Our new estimate for how much bad meetings cost the US economy each year falls somewhere between $70 and $283 Billion.
Findings: Way more meetings, better than we thought, cash money. Now what?
We started into this investigation when we discovered that the statistics we’d been quoting were wrong.
Every day in the US, there are somewhere between 36 and 56 million meetings, not 11 million.
There is no consensus on what percentage of meetings are effective. Not only do different people express varying levels of perceived quality; individuals will give wildly incongruent answers if you re-word the question and ask it more than once in the same survey.
The cost of ineffective meetings is higher than $37 billion. That number comes from 1986 or earlier when our economy was $4.5 trillion. Today’s economy is closer to $17.5 trillion, so of course the meeting cost is higher. More importantly, the data does not support a claim for any specific number of dollars wasted on bad meetings. It’s all best guesses based on thin information and generalizations.
Why this matters
Every now and then, it’s important to take a critical look at our myths because they inform and shape our decisions.
When we believe and spread the idea that meetings are a “necessary evil”, we create the impression that bad meetings are intractable. We begin to think that working to improve your meetings is largely pointless (clearly, they all still suck for everyone, so why bother?) and that you’re probably better off if you meet as little as possible.
We see organizations proudly claim “they don’t do meetings”, as they opt instead to share all their information through email or group chat – using interrupt-driven ways of communicating that research shows to be a much bigger hit on productivity than the meetings they replace (sources: BBC, Microsoft, University of Illinois, Basex).
We see articles like this one from HBR: This Weekly Meeting Took Up 300,000 Hours a Year, which details all the time spent in one organization to support an executive meeting. They say it’s time “squandered”, but include no evidence that the meeting’s purpose is unnecessary or that the results could reasonably be achieved in either a more efficient or effective way.
Many people saw and shared that article as the evidence they needed to cancel their meetings, and avoid the work involved in learning to run better ones.
Bad numbers lead to bad assumptions, and bad decisions.
Please help improve our understanding
The more you know, the more you know you don’t know.
Aristotle
I learned an enormous amount researching this article, and have had to revise some of my beliefs about meetings in the process.
I also hit the limits of my research and mathematical abilities. I found references to several studies, but could never find the originals. The US Labor Statistics are a little confusing, and none of the derived summaries published by other organizations added up like it seemed they should, so I’m clearly missing something there.
Finally, we have questions about what’s really going on in meetings for which the existing data provides no answers.
3 ways you can help
- Check the results
You’ll find links to all the sources we used below. Is there a flaw in the logic or an error in the math? Let us know. - Share what you know
Do you know about a study we’ve missed that sheds more light on this topic containing first-hand data? Please send us a link. - Take this survey
Let’s stop guessing. This short survey asks direct questions about how often and well people really meet. It takes 5 minutes or less to complete.
References
- Forward to Facilitator’s Guide to Participatory Decision-Making
- U.S. Bureau of Labor Statistics overall employment data for the US
- U.S. Bureau of Labor Statistics Occupational Employment data from 2014
- Meetings in America by infocom for Verizon
- 2005 Microsoft Office Personal Productivity Challenge (PPC)
- Meeting Analysis: Findings from Research and Practice
- The Meeting Behavior Survey by Fuze
- Collaboration 2.0: Death of the Web Conference (As We Know It) by Ovum
- A Profile of Meetings In Corporate America: Results of the 3M Meeting Effectiveness Study
- 2015 State of Enterprise Work Report by WorkFront
- ‘Infomania’ worse than marijuana
- Disruption and Recovery of Computing Tasks: Field Study, Analysis, and Directions
- The cost of not paying attention: How interruptions impact knowledge worker productivity
- The World Bank Data on GDP