How many meetings are there per day in 2022? (And should you care?)
This is a popular search. For those of you building infographics and reports and term papers, here’s the bottom line up front.
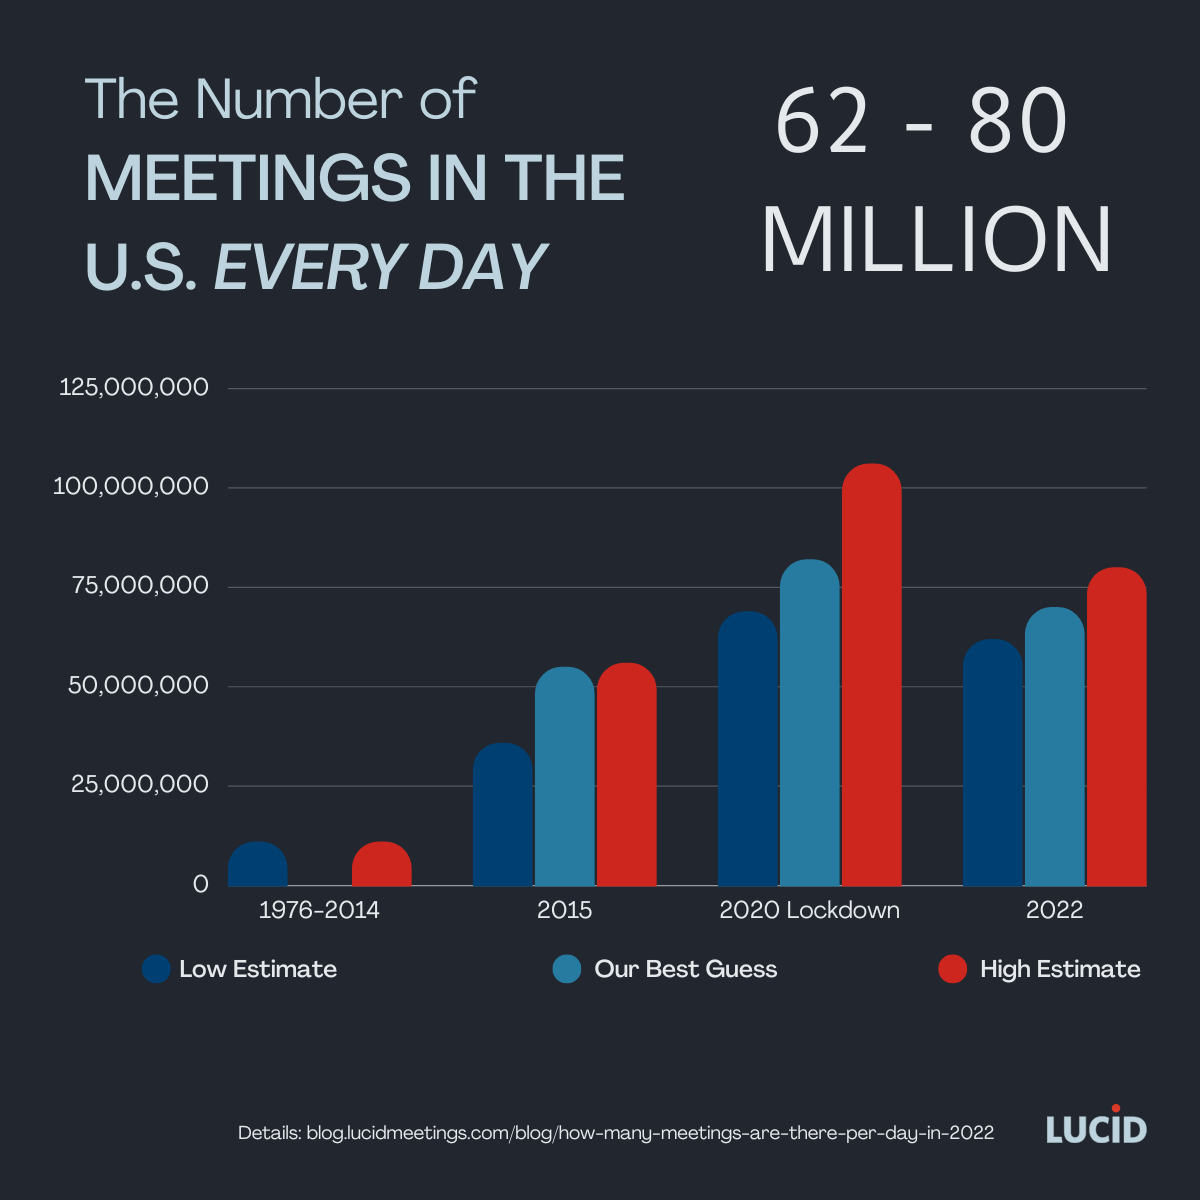
Our 2022 best-guess estimates for the number of meetings per day in the US:
- 1976: 11 million
- 2015: 55 million
- 2020 lockdown: 80+ million
- 2022: 62 to 80 million
For everyone else, read on to understand where these numbers come from, why they’re irrelevant for most people, and when (or if) you should care about the number of meetings in your organization.
Part 1: How many meetings are there in 2022?
Between 1970 and 2015, most articles stated that there were 11 million meetings per day. Like so many others writing about the importance of meetings, I wanted to include a number like this in an article I was writing. After all, if there are a lot of meetings, surely it must be important to pay attention to them!
But something about the 11 million number bothered me. At the time, there were more than 146 million employees in the US. I had trouble believing there were only 11 meetings per day for every 146 people, so we dug into this apocryphal number. By combining survey data, employment statistics, and workplace trends, we arrived at a conservatively updated number of 55 million meetings per day.
You can read more about that work here: 55 Million. A fresh look at the number, effectiveness, and cost of meetings in the US. (2015)
Since then, the 55 million number has spread a bit, although many writers still quote 11 million meetings per day.
Really, though, it doesn’t matter. Those numbers are based on generalized survey data and assumptions anyway.
Today, we have new surveys and sources of information that tap directly into our digital communications infrastructure. These sources reveal how meeting patterns have changed in reaction to the COVID-19 lockdowns and ensuing events.
The Data We Used
Here are some examples:
The Immediate Impact of Lockdowns on Meeting Numbers
July 2020: The impact of COVID-19 on digital communication patterns
DeFilippis, E., Impink, S.M., Singell, M. et al. The impact of COVID-19 on digital communication patterns. Humanit Soc Sci Commun 9, 180 (2022). https://doi.org/10.1057/s41599-022-01190-9
A group of Harvard researchers analyzed anonymized communication system data from over 3.1 million people, starting 8 weeks before lockdowns through 8 weeks after lockdowns. They published their findings as a working paper in July 2020 and formally in May 2022.
This is the largest data set reviewed that I could find.
The Harvard team found a 12.9 percent average increase in the number of meetings.
Those meetings were often shorter and included more people, leading to a net reduction in time spent in meetings of 11.5 percent.
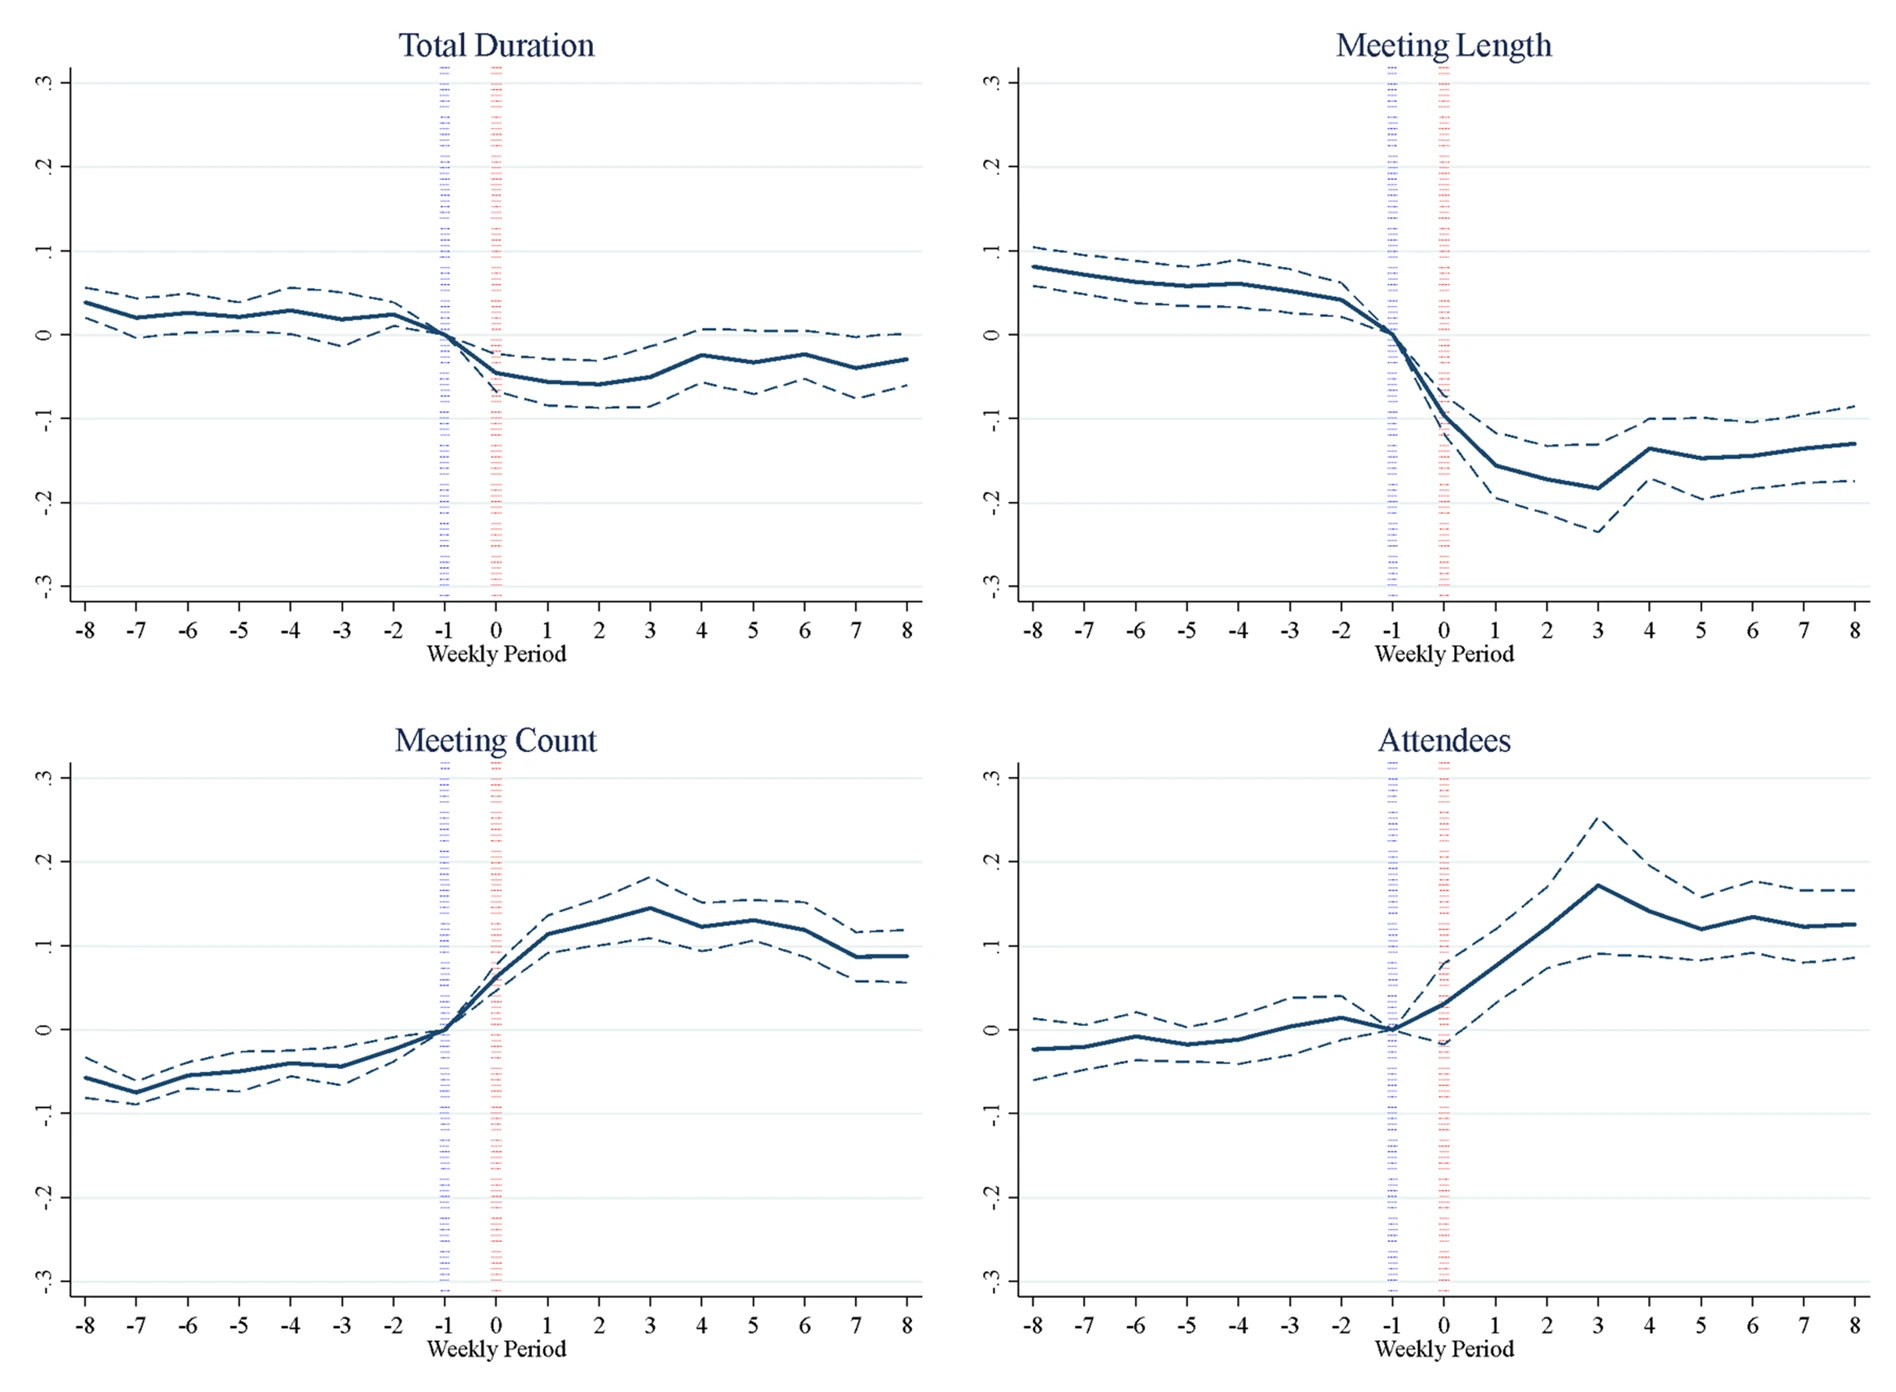
This study also looked at email patterns, which took about four weeks to return to pre-lockdown levels. Meeting patterns didn’t reliably return to pre-lockdown levels in the same way.
Other findings:
- When people work from home, the average workday span increased by 49 minutes. This is measured as the time of the first work communication (email, meeting, chat, etc) to the last one of the day. Important note: workday span is NOT a measure of hours worked.
- The authors saw cultural differences. Meeting patterns in some regions quickly returned to pre-pandemic levels. In other places (the Bay Area, for example), meeting load remained high.
How this Influences Our Guesstimates
In 2015 we estimated that 146 million workers participated in 55 million meetings per day. We now estimate that, by 2020, 165.7 million workers (a reported 13.5 percent growth in the workforce) were participating in about 62 million meetings per day (i.e., a corresponding increase over the 2015 estimate).
Multiplying that 2020 number by the observed 12.9 percent increase due to the COVID-19 lockdowns, we get a new guess of 69.9 million meetings per day.
July 2020: Survey Results: How often do teams meet during a crisis?
We conducted a small-scale survey of our newsletter subscribers, asking them specifically about meetings with their primary team during the initial weeks of the lockdown.
Before the lockdown, teams averaged 7 meetings per month. During the lockdown transition weeks, the average increased from 7 to 12. This represents a 71 percent increase during that time.
How this Influences Our Guesstimates
We started with our adjusted estimate of 62 million meetings per day in 2020, then increased that number by 71 percent to give us 106 million meetings per day during the lockdown transition weeks.
This was a comparatively tiny survey. I’m sharing it now because I have access to the raw data, which helps illustrate the problem with all averages. Our averages tell a similar story to the one you’ll see in the other reports highlighted here. The detailed data, however, reveals a wide variation in experiences.
While half of the teams surveyed reported an immediate increase in the number of meetings during the onset of lockdowns (5-10x in some cases), the other half saw either no change and in some cases, a sharp decrease in team meetings.
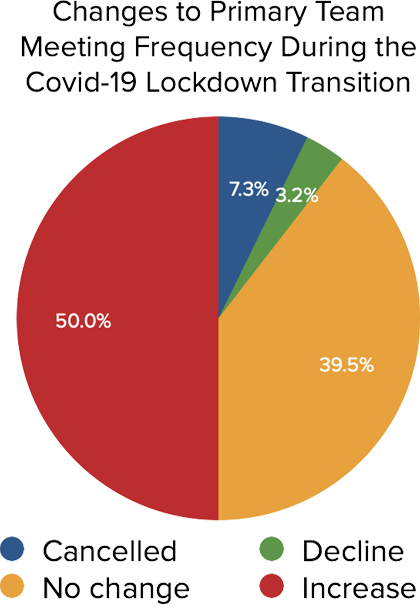
Of those that experienced an increase, many saw this number return to near pre-lockdown numbers by late summer 2020, while others maintained persistently elevated meeting loads.
Mid-Lockdown Patterns
Pew Research Center, December 2020, “How the Coronavirus Outbreak Has – and Hasn’t – Changed the Way Americans Work”
In October 2020, Pew Research Center analyzed data from 5,858 U.S. adults working part or full time. This wasn’t a study about meeting numbers per se, but about work in general.
The key findings that relate to meeting numbers are these:
- Only 38 percent said that, for the most part, the responsibilities of their job can be done from home. This means 62 percent of the population continued in-person work.
- Of the 38 percent of people working from home, 81 percent reported using video calling or online conferencing services like Zoom or Webex at least some of the time. This means that 19 percent of those working from home held zero online meetings.
- Of those using online conferencing, the majority (63 percent) are fine with it. The much-studied phenomenon of “Zoom fatigue” was not seen as a widespread issue.
While this wasn’t a meeting study, I found it especially useful because it’s the only one of these studies specific to the US and inclusive of all workers. This study shows that increased meeting load is a problem of the privileged classes; not a widespread population problem.
How this Influences Our Guesstimates
Our data sets all come from people who use online calendar systems and online meeting tools. This study suggests that estimates based on auto-generated reports may only apply to 25 percent of the workforce.
I know the other 75 percent attend meetings too, but there is no data to suggest they experienced the same big increases in meeting load. My farmer and nursing and military family members aren’t complaining about meetings, and neither are their colleagues. This suggests that we shouldn’t be applying large growth multipliers to all meetings. So while I’m tempted to guess much higher numbers, that would be an overreach.
Late and Post Lockdown Reports
Microsoft Work Trend Index
https://www.microsoft.com/en-us/worklab/work-trend-index/
Microsoft publishes an analysis of aggregated and anonymized data from their users each year.
The 2021 report analyzed Microsoft System data from over 30,000 people. They compared usage from February 2020 to January 2021. Key findings included:
- 2.5x more Microsoft Teams meetings
- 148 percent increase in meeting time
- 45 percent increase in chat traffic
For anyone who used Microsoft Teams in early 2020, you’ll remember that the product improved a lot in the last two years. It’s possible this increase wasn’t just about changing workplace trends.
Another critical finding:
- 62 percent of calls and meetings were unscheduled or conducted ad hoc
This creates a challenge for our meeting counts, which we’ll explore below.
Finally, this report shares a concern about a perceived increase in close-team communication and a subsequent decrease in cross-team communication. The concern is that this means teams are becoming more siloed, which raises the risk of groupthink and inhibits innovation.
That said, the data doesn’t include any measure of pre-lockdown in-person communication, so it’s really hard to tell if close-team communication actually increased rather than just changed mediums.
The latest version of the Work Trend Index, published in March 2022, highlights:
- A 252 percent increase in weekly time spent in meetings for the average Teams user since February 2020 (so just a tiny bit more than the 2021 report)
- A 32 percent increase in chats sent per person since March 2020 (down from the 45 percent reported the previous year)
Like the Harvard study, Microsoft also found that the workday span increased more than 13 percent (by 46 minutes) since March 2020.
Meeting data is a small part of these reports. Both reports include several findings related to employee attitudes toward the “great reshuffle.” In 2022, they reported that 38 percent of respondents were working a hybrid schedule including at least some time face-to-face with their co-workers.
How this Influences Our Guesstimates
Microsoft reported that 62 percent of the increase was in unscheduled and ad-hoc conversations. Many of those aren’t really meetings. This suggests we should reduce our overall multiplier.
Reclaim’s October 21 Productivity Report
From the report:
Reclaim.ai is a smart calendar tool that helps busy professionals create time for anything they care about. This report of survey-based and aggregated data across +15,000 people between Feb 2020 – Oct 2021 reveals the phenomenon of longer workdays post-pandemic and the impact of one-on-one meetings.
This report includes the most dramatic meeting numbers. Key findings include:
- A 500 percent increase in 1:1 meetings (average 0.9 to 5.6 per week)
- A 69.7 percent increase in total meetings (15.1 to 25.6 per week, or 5.1 per day)
- A workday span increase of 1.4 hours per day
- ZERO people who conduct all their meetings in person. In fact, this data set only included 2.3 percent of people who attended up to 30 percent of meetings in person.
Since this data comes from the Reclaim data set, we can assume that it reflects the meeting patterns of people comfortable using an AI calendar assistant (and others with whom they meet) who are also focused on improving personal productivity.
While these are stunning numbers, when placed in relationship to the earlier reports, we can surmise that this report reflects the “average” experience of a very particular population subset.
How this Influences Our Guesstimates
Applying the 69.7 percent increase to our baseline gives us nearly 105 million meetings per day. That’s the new high-end estimate.
Because this data appears to represent a very specific subset of the total population, however, we believe a more accurate estimate should be much lower.
Converging on New Estimates
So after all that, here again are our 2022 best-guess estimates for the number of meetings per day in the US:
- 1976: 11 million
- 2015: 55 million
- 2020 lockdown: 80+ million
- 2022: 62 to 80 million
As you can see, most sources note a general rise in the number of meetings, starting with a dramatic increase in early 2020 at the onset of the lockdowns.
Our new estimates could be way off, but whatever the true number is, we all agree that it’s a doozy. Lots and lots of meetings – for some. For millions of others, their meeting schedule was reduced to a few updates from headquarters about when or if they could return to work.
None of the studies agree on how much time those meetings occupied. The Harvard data found that while the total number of meetings increased, the total average time spent in meetings actually went down. This is because many teams switched from a few, longer meetings to lots of very short meetings. Other studies found both meeting numbers and meeting time increased.
The studies also don’t agree on whether this rise indicates a temporary aberration or a new baseline. Each report opens a window into the larger meeting data universe at a moment in time, and in the meantime, the train of events is swiftly entering new territory. As I’ll discuss below, the meeting landscape continues to evolve around us.
Finally, the studies don’t agree on what constitutes a meeting. What exactly are we counting when we tally up the average number of meetings? It turns out that the answer to this question is surprisingly difficult.
Part 2: Are these estimates relevant?
Three things led me to look askance at all large-scale meeting statistics.
First, the 11 million number was happily repeated for 39 years before we looked into it. Obviously, the number wasn’t being used for anything that anyone really cared about, because if it was someone else would have updated it much sooner.
Second, there’s no way to get a reliable count.
Why It’s Hard to Count Meetings
Problem One: What Counts?
The first challenge is the definition of a meeting.
Everyone seems to agree that a weekly team meeting or a board meeting should count. Most agree that a job interview is a meeting, but fewer feel this way about the coffee date with a mentor. Some believe that only meetings conducted as part of a person’s primary job should count. Others feel that all the meetings, including the meetings for side hustles, community groups, and volunteer organizations, contribute to a person’s overall meeting load. Most meeting studies fail to clarify this context.
Beyond the general context, there is a question of degree. Some believe that for an event to be considered a meeting, it must include at least three people. On the other side, studies like the ones conducted by Microsoft and Reclaim include a huge number of two-person “meetings.” Reclaim, Zoom, MS Teams and other communications systems capture reports by looking at calendars and call data, which lack the ability to distinguish between the annual performance review with your boss (definitely a meeting) and the quick ad-hoc call with the folks in marketing about a change to the newsletter (not really a meeting, IMO).
Problem Two: Plans vs. Reality
Even if we agreed on the definition of a meeting, we have very little ability to count what happens in reality.
Just consider:
- If someone is invited to three meetings overlapping the same time, and partially attends two of them, how do you count that?
- If the meeting is scheduled for 30 minutes, but lasts for 90 and prevents someone from attending two others, how should that be counted?
- If a colleague asks someone to join a meeting to which they weren’t originally invited, how is that accounted for?
- If there’s a meeting with ten people, but three of them are cameras off, muted, and focusing instead on completing other work, how should that be counted? Were they really “in” the meeting?
The calendars can’t tell us what really happened. They can only signal intentions. Sometimes they reveal competing intentions, and the reports try to make the best sense of it that they can. For example, you can read a bit about how Microsoft’s Via Insights is trying to reconcile situations like these.
The communication platforms (MS Teams, Zoom, etc) report actual communication episodes, but they can’t distinguish between a meeting and a conversation. What’s more, they can only account for the communication that occurs using their tools. In-person meetings don’t exist in their world.
Neither calendars nor communication platforms can reliably count the number of real people involved in a meeting. When two people appear in a single video conferencing window, they are counted as a single attendee by the system. Calendars may overestimate the number of attendees by counting other systems invited to the meeting as people, so every automated helper application with an email address adds to the headcount.
All of the automated reporting approaches leave a lot of reality unaccounted for, and while these data challenges could be normalized by agreeing on standardized ways to handle them, those standards do not yet exist.
The third reason I question meeting statistics is that the numbers quoted often conveniently back up the author’s case. Right now, we’re seeing four different workplace trends that impact meeting loads. Since each trend impacts different teams, this makes trying to find a single “average” number of meetings even less relevant than it was in 2015.
Four Competing Trends Impacting Meeting Numbers
Trend 1: More meetings
Yes, many teams are meeting more. For some, they piled on lots of new meetings when the lockdowns started and they’re still meeting way more than they did in the past. More people are complaining more publicly about meetings now too. Words like meeting load and zoom fatigue and meeting recovery time, previously relegated to scholarly articles and obscure blogs like this one, now appear regularly in the mainstream press.
Trend 2: More meeting-load interventions
In response, more companies are experimenting with interventions such as meeting-free days. Some – Salesforce and Nike included – have declared entire meeting-free weeks. When companies employing thousands of people cancel a whole week’s worth of meetings, the overall meeting count quickly drops.
Trend 3: Ongoing Upheaval
The Great Resignation, the Great Reshuffle, and a great big bag of economic gyration mean that we do not yet have a new baseline.
Will organizations settle into new, more predictable communication patterns? Or will they continue to be buffeted by a rotating cast of new team members and organizational change initiatives? Statistics are most informative when they show you a change from normal. There is no normal right now.
Trend 4: More intentional meeting design and increased use of asynchronous communication
To combat the lack of a larger cultural normal, some organizations have created their own normal. They’ve redesigned how they work, and as a result, they experience less variability in their communications. For example, many daily stand-up meetings became asynchronous daily check-ins. Two-hour meetings gained more structure, embraced time spent in silent reading and co-authoring, and quickly took on a fitter, slimmer meeting profile. Practices like rolling agendas, optional meetings, and distributed meeting notes are reducing the average number of meeting attendees.
With these competing trends at play, we see organizations experiencing very different meeting loads.
All this variability raises the question: is calculating a US (or global) average number of meetings per day useful? What value can there be in knowing that number, beyond looking smart in an article?
Personally, as someone who’s looked at these numbers often and deeply, I posit that they are mostly pointless.
Part 3: When is it useful to count meetings?
Mostly pointless is not the same thing as entirely pointless. Thank goodness, because otherwise I’ve spent WAY too long putting this article together! 🙂
There are two scenarios where I find meeting numbers really useful, and you might too.
Using Meeting Statistics in the Media
As researchers and authors, we often use stats like the average number of meetings in the US (or some other huge population) to illustrate a point.
Just as a fish dying in the ocean is not news, but thousands of fish dying in one spot on one day most certainly is, meeting numbers are meaningful when they reveal a significant change. When the estimate goes from 11 million to 55 million over the course of 40 years, then jumps to 80+ million in a matter of weeks, that feels significant.
Beyond a dramatic rise in response to global lockdowns (which, let’s face it, we didn’t have to count meetings to notice), we’re left with the most important question to ask when counting meetings.
What else might constitute a “significant” change? And what forces might drive those changes?
The answer depends on what is considered normal.
Country-wide averages are built from the averages across many organizations, all with different baselines. Some jobs involve lots of meetings and others very few.
Given that, a significant change in the average number of meetings across a country could be an indication of:
- Changes in the labor force, with large numbers of people moving into jobs with different expectations around meetings.
- An increase or decrease in economic activity. More projects and trade = more meetings. Less activity = fewer meetings.
- Changes in communication norms. Maybe in the future, nobody will meet because they’ll all have neural implants that make gathering unnecessary. Or perhaps we’ll live in anarcho-syndicalist communes and take it in turns to attend the executive meeting each week. It could happen.
Whatever this larger number signals, it applies very broadly and in a very general way to the world of work. This number has no relevance to your organization. For that, you’d need to know what a normal number of meetings is for you.
Using Meeting Statistics in Your Business
Product developers might use these numbers to estimate the total addressable market for their meeting products. In a twist of irony, successful meeting products should lead to more effective meeting behavior, thereby lowering the number of total meetings in the market. Good thing there are still plenty of lousy meetings to go around!
Researchers, coaches, and consultants might quickly gain insight into an organization’s health by reviewing meeting data. When you see what an organization considers normal, outside experts can easily see opportunities for improvement.
A change in an organization’s meeting load can also provide clues about the underlying causes of a change in overall performance.
For example (and in my experience), a dramatic increase in the number of meetings should be viewed like a fever in the human body. This often happens in the face of a sudden challenge, and the meetings are the communication mechanism an organization’s “immune system” uses to coordinate its response. But if left unchecked for too long, a high meeting load burns teams out and leads to high turnover.
The reverse is also true. If teams often skip meetings and the frequency never picks back up, momentum languishes. If left unchecked, your work will slowly freeze up and die.
In this way, trends in an organization’s average number of meetings provide a birds-eye indicator of the organization’s overall health.
That said, if you are a business leader, I don’t think this warrants the effort required to count all your organization’s meetings.
As a business leader, you should track the number of meetings IF:
- You can establish a baseline and an ideal.
- The meetings are strong indicators of job performance.
- You can track these numbers over time.
Establishing a Baseline and an Ideal
You can establish a baseline count of meetings in several ways. These audits can be time-consuming, but they’re also easy to delegate because it’s basically, well, just counting.
We’ve documented some ways to go about it here:
Are there better ways to collect quantitative meeting data?
(Note: that link goes to a conversation on the Meeting Innovation Community. Access is free, but logins are required.)
Determining how many meetings there should be will require more thought because you have to decide how meetings relate to your goals.
- If you have a well-defined meeting system that spells out the meetings that team members should have on their calendars, use that as your ideal.
- If each meeting brings you more business, then your ideal number of meetings is determined by your capacity and growth targets. For example, you may want the sales team to have as many new customer meetings as possible.
- If your business thrives when people have lots of focus time for other work, then your ideal meeting count will be measured in blocks of uninterrupted time rather than by the number of meetings.
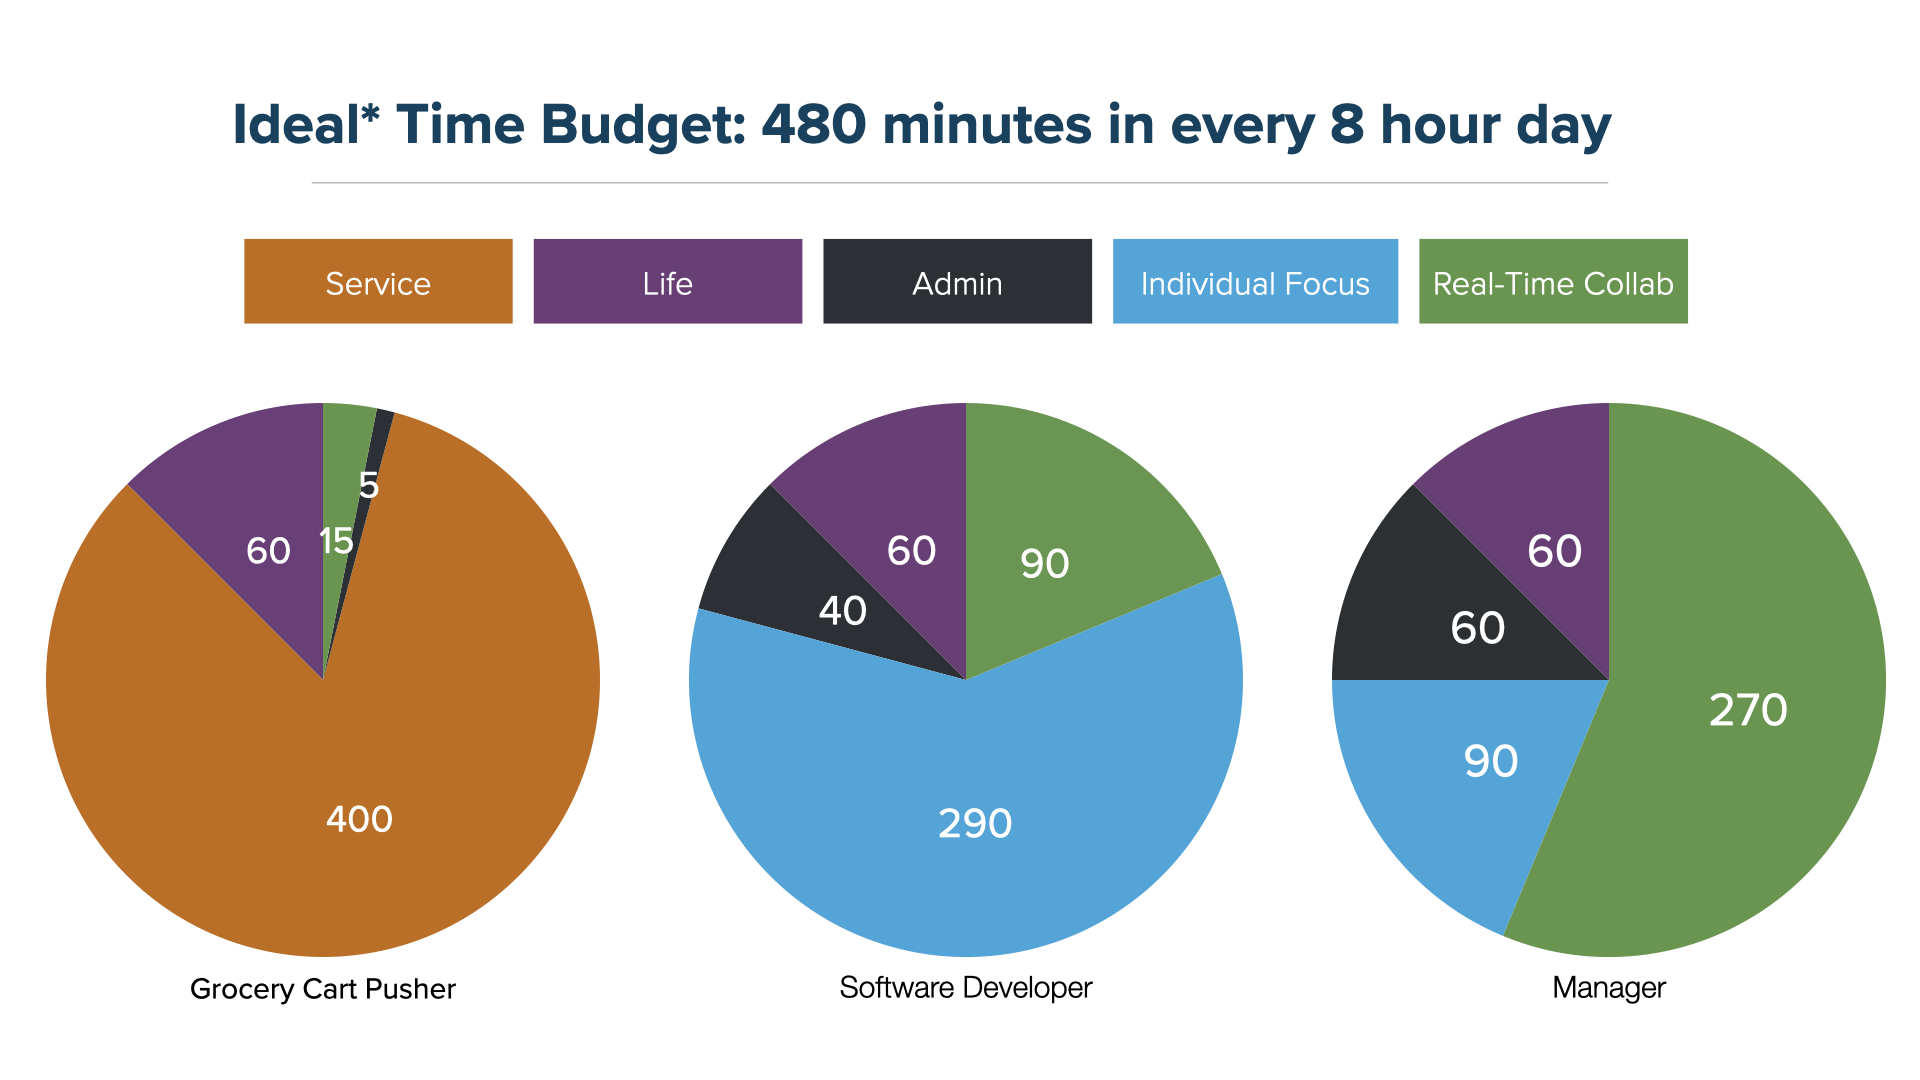
Build these time budgets in collaboration with each team member to simplify future conversations.
This article and this program cover how to design meeting systems and find your team’s ideal.
Counting the Meetings That Count
Some meetings relate more directly to job performance than others.
When a meeting is THE JOB.
- Sales, marketing, fundraising
- Coaching, consulting, customer service
In these situations, you want the number of meetings to go up because an increase in meetings = an increase in productivity.
- Interviewing, onboarding, training
- Governance (board meetings, etc)
For these, you want the numbers to match expectations. These meetings keep promises and represent the fulfillment of legal duties. Too few and you incur undue risk. Too many and you’re running a sloppy business.
When the number of meetings is identified as a key barrier preventing THE JOB from getting done.
- Individual performers, production staff, etc
- Poor coordination, silos, etc
In these situations, a meeting inventory is a diagnostic tool. Use it to find and eliminate waste in your Meeting Operating System.
When the number of meetings is a proxy for THE JOB.
- Action Reviews, Design Critiques, etc.
- Workshops
- 1:1s
- Social hours
These are activities conducted to support the desired culture. Culture is hard to count, so the presence or absence of these meetings may serve as leading indicators for those cultural trends.
Tracking Meeting Numbers Over Time
Once you have a baseline count and a way to predict what the numbers should be, you can monitor them over time to see when things are out of whack.
I’ve seen leaders complete an initial meeting audit, parade the results in a PowerPoint, then never look at them again. Internal journalism is handy for making a point, but not as useful for making change.
Change-makers will benefit from regular audits and should schedule audits and action reviews in advance.
If you’re just getting started with this process, expect variation. That’s normal. It’s like tracking the weather, heart rates, and revenue. Variations that aren’t too far off our predictions are no big deal. Measures that are regularly high or low, on the other hand, tell us that our system needs work. Treat big, unanticipated variations as major warning signs.
And always remember: the number doesn’t matter. What matters is how the meetings that this number represents impact your organization.
The Real Story is About People, Not Numbers
If you’ve found this article intriguing, you’ll love digging into the studies. They’re full of tantalizing tidbits.
- Workday spans vs hours worked: are we getting closer to embracing a management focus on results rather than “butts in seats?” The Harvard and Microsoft studies hint that this might be possible.
- Gen Z is having an entirely different experience than older generations. How much of this is related to recent global changes, and how much is endemic to being new to the workforce?
- Working parents report some of the biggest challenges with productivity when working at home, and the greatest desire to work from home long term. How might we design work to gracefully embrace that phase of delightful contradictions?
- Tech-savvy, college-educated people working to optimize their personal productivity will find fabulous insights in the data from Reclaim and Microsoft. Do we have an obligation to acknowledge that these insights are wholly irrelevant to the vast majority of our population? Of our neighbors?
As we all find our way to the next normal, my hope is that we don’t use articles like this one just for their shock-n-awe clickbait value.
My hope is that we get more curious.
Now I’m curious: what caught your intrigue in these studies? How would you estimate meeting numbers in your world, and how would you use those estimates? Please share your feedback below.
Appendix: 55 million meetings per day in 2015
You can review our original 2015 article and methodology here: 55 Million: A Fresh Look at the Number, Effectiveness, and Cost of Meetings in the U.S. Or simply page through this PDF document to learn more!